The Power in your Data
Our industry standard API-first solutions interface directly with your existing workflow and systems, seamlessly empowering your understanding.

Visible
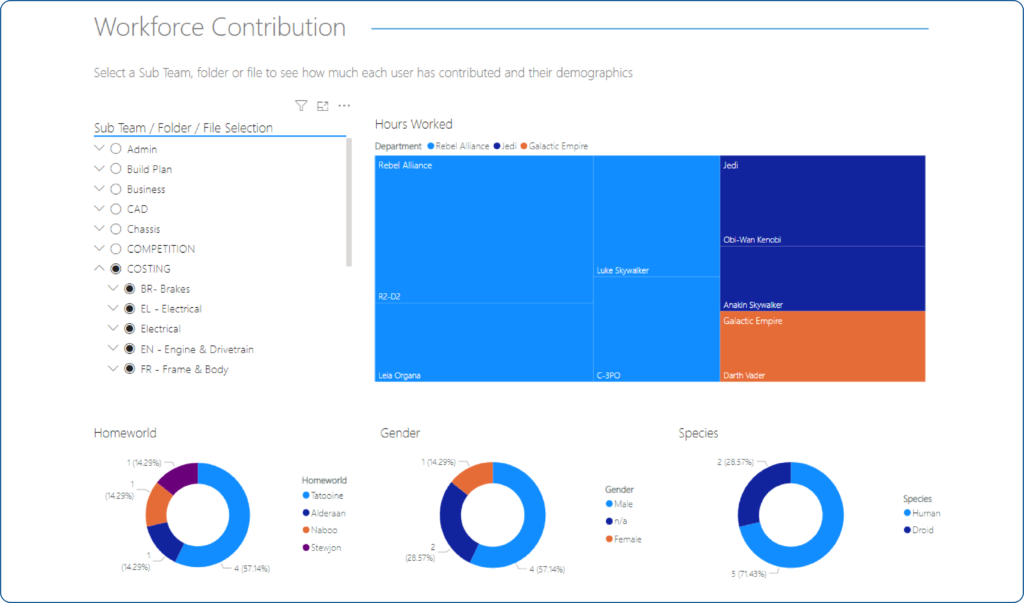
Build and interrogate interactive maps of your entire workforce, assets, and activities no matter where they are in the world or when they work.
Healthy
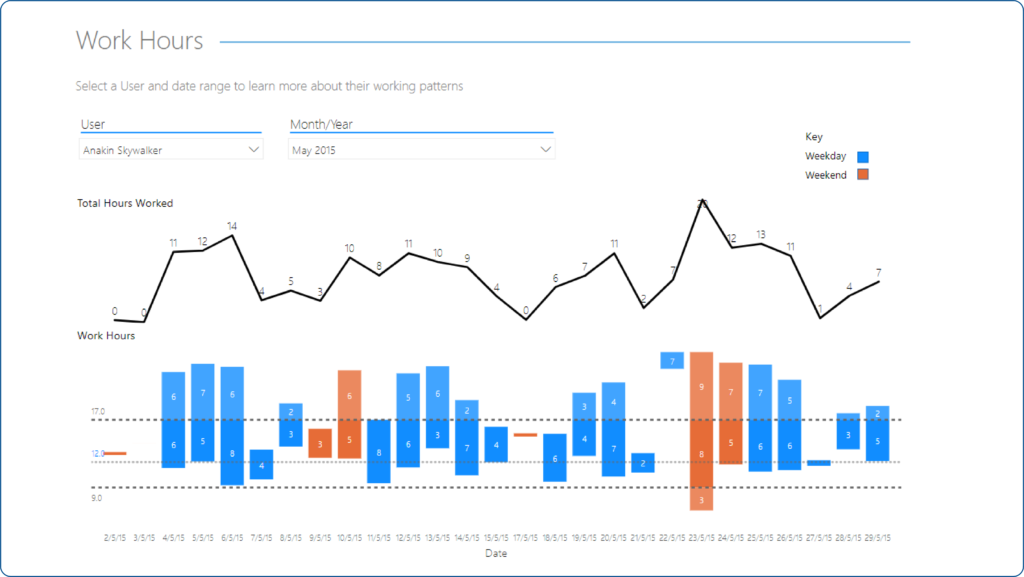
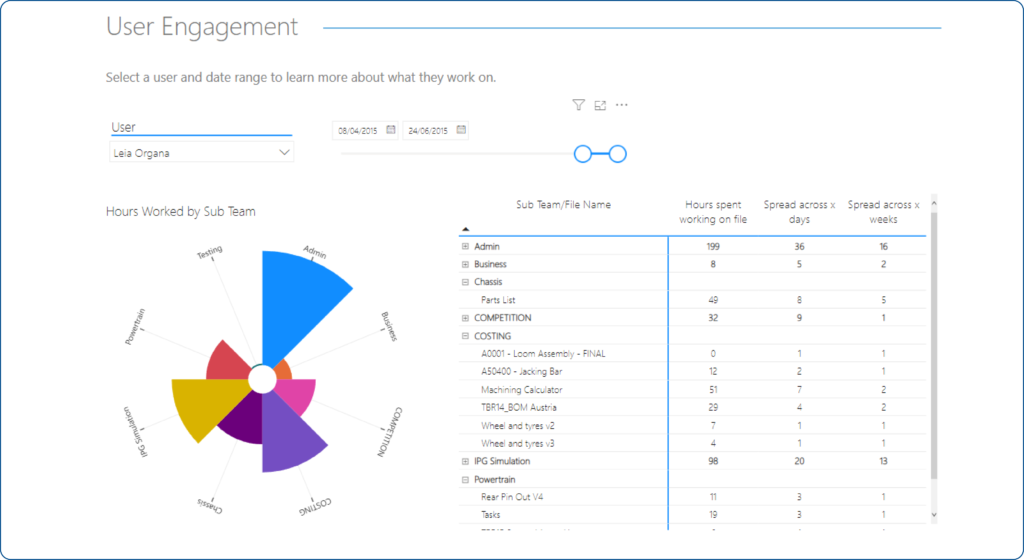
Monitor engagement, workloads, and burnout. Check your team compositions, and ensure that diverse teams are balanced and working well.
Productive
Evidence-base your decision-making and management. Track productivity and performance across people, teams, and functions.
Knowledge-on-demand.
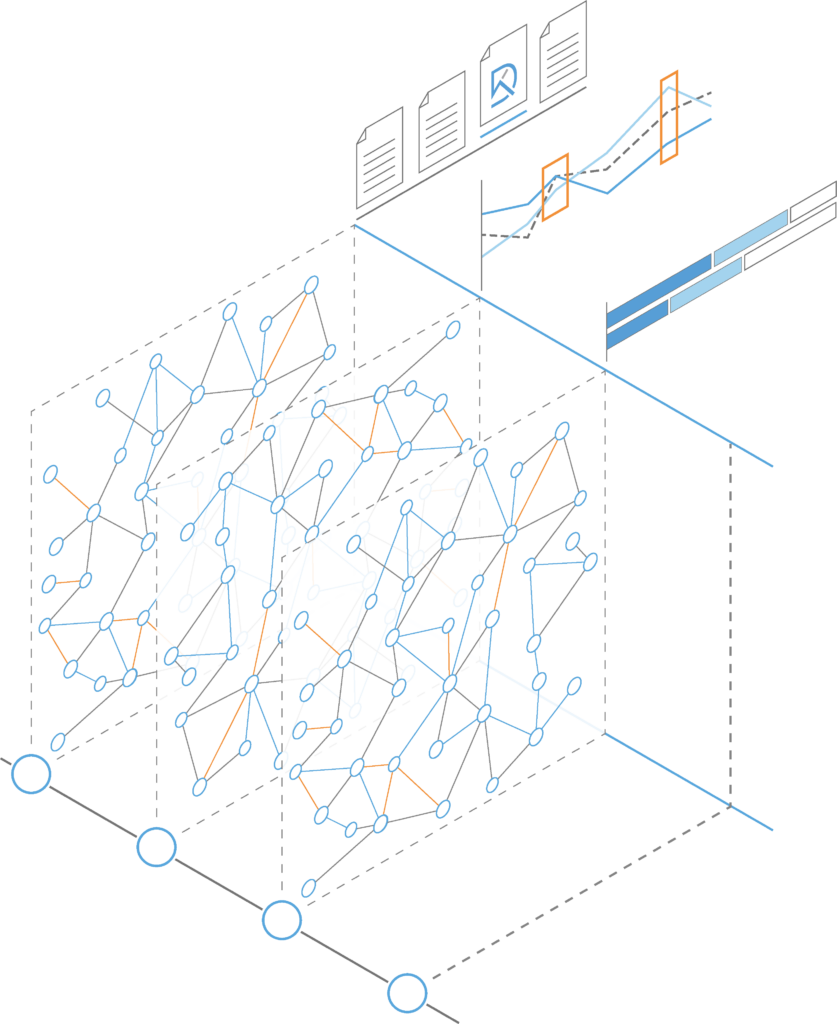
All organisations create a wealth of data as part of day-to-day operations. This data heartbeat is embedded with a wealth of knowledge, capturing your activity, productivity, and history.
We provide analysis-as-a-service to capture and interpret the pulse of your organisation through our API-first platform, either locally or on the cloud.
Integrate with your workflow.
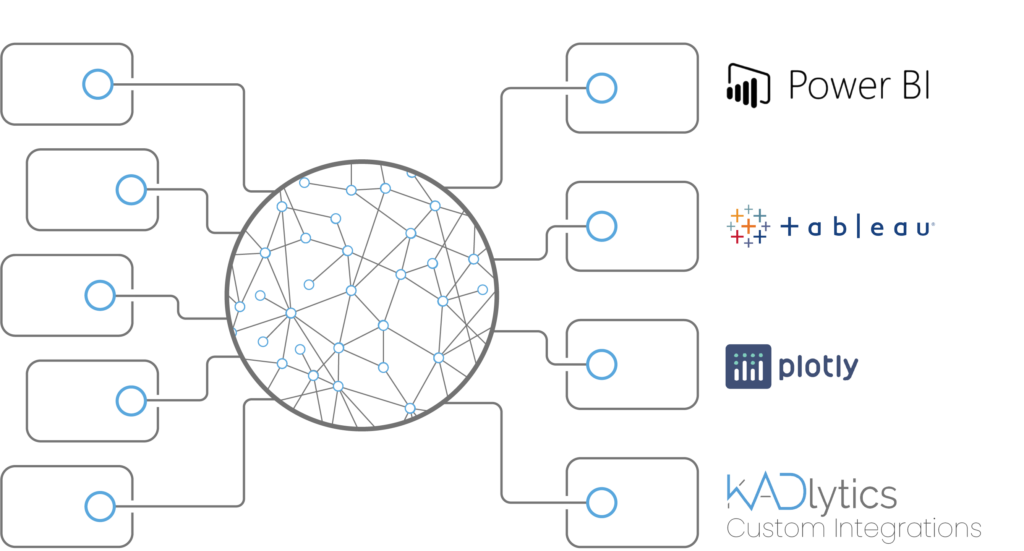
Industry-standard API integration interfaces directly with your systems and databases.
Integration with major vendors embeds our tools directly within your existing workflow, powering up the tools and interfaces that you already know.
Your Data, Your Way.
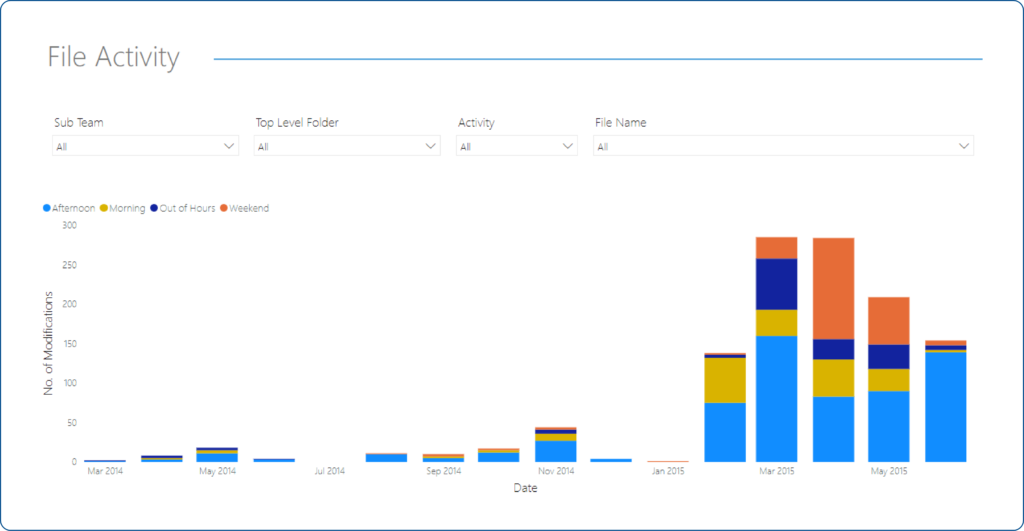
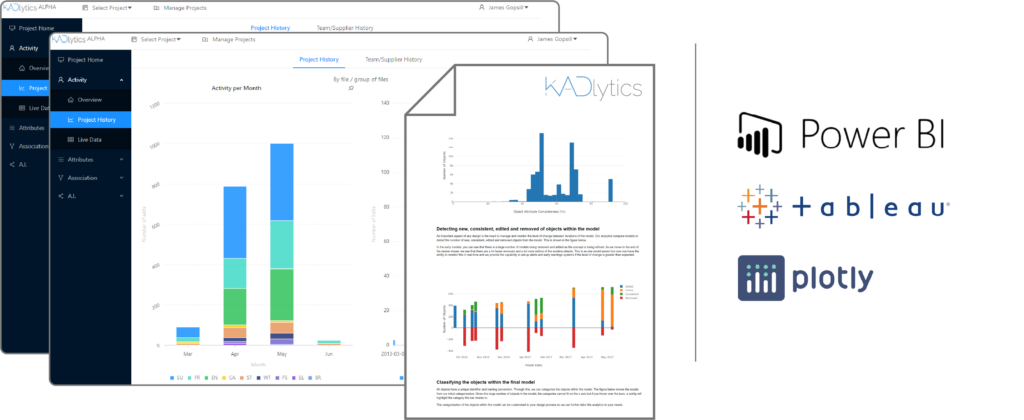
Refactor the data we produce into dashboards that give you the information you need, in the formats that you need it. Create bespoke summaries for teams or individuals, monitor activity and patterns in real time, or output data into reports for daily review or monthly checks.
Explore your data
Industry-standard visualisation front-end puts you in control of your data, and empowers you to generate the data you need.
Integrate your visuals into your existing systems, choose from pre-packaged options, or co-create exactly what your system needs.
Case Studies
Workgraphs in Major Programmes
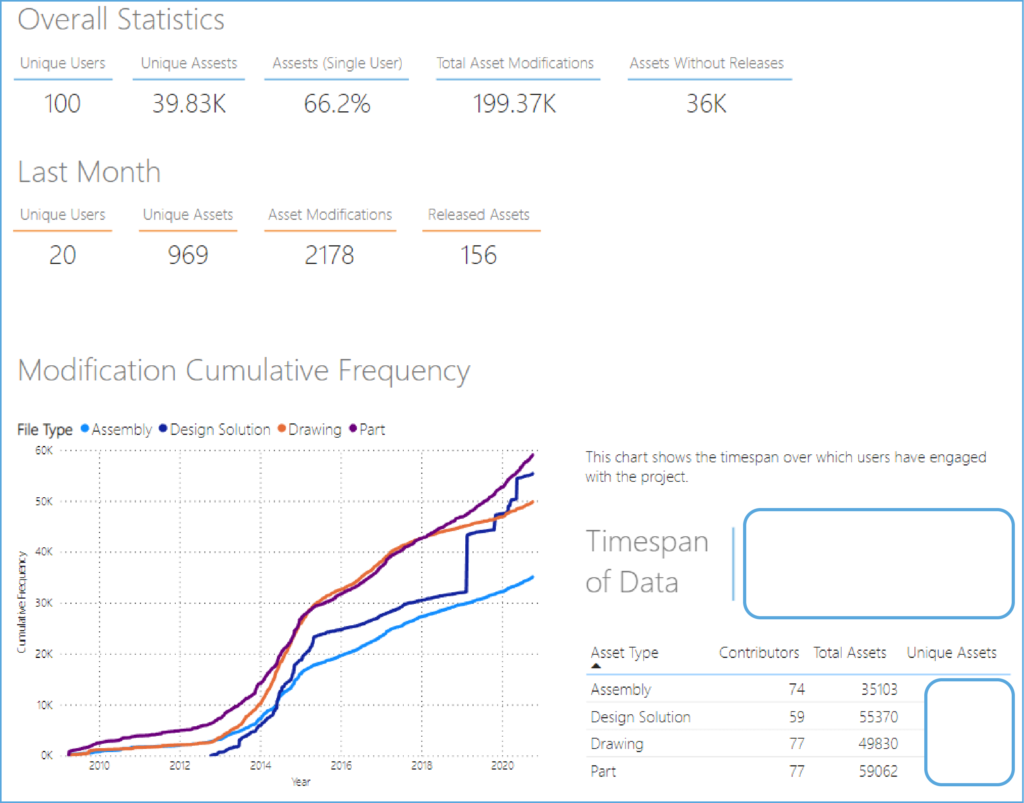
Large programmes of work can involve hundreds of thousands of assets, access by hundreds of users, over decades.
Our tools create a single source of truth that spans all project data platforms, with custom dashboards giving managers and team members the power to interrogate and navigate these complex structures and drive productivity.

Workgraphs in BIM: Automated management in large construction projects
Large construction projects require the concerted efforts of many organisations that are responsible for different aspects of the design.
Our tools have been used to automatically monitor activity across these organisations, people, and teams, providing managerial oversight and progress monitoring capability.
Workgraphs in NPD: Insights into technical dependencies
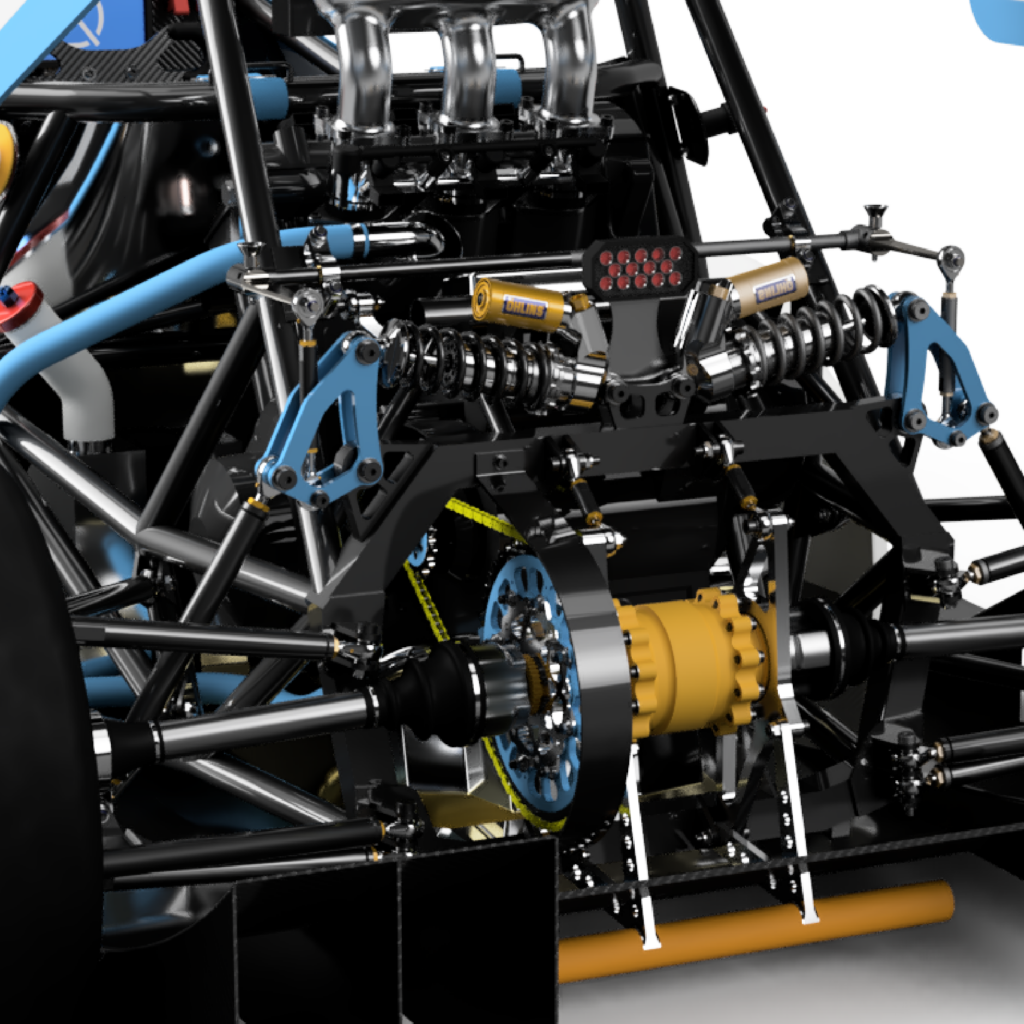
The technical architecture of complex systems is emergent and non-deterministic, evolving and growing as the development process continues.
Our tools can be seamlessly have been used to automatically capture, map, and track system dependencies, supporting better understanding and optimisation of system architectures and predicting the impact of change.
Workgraphs of Teams: Insights into dependencies and structures
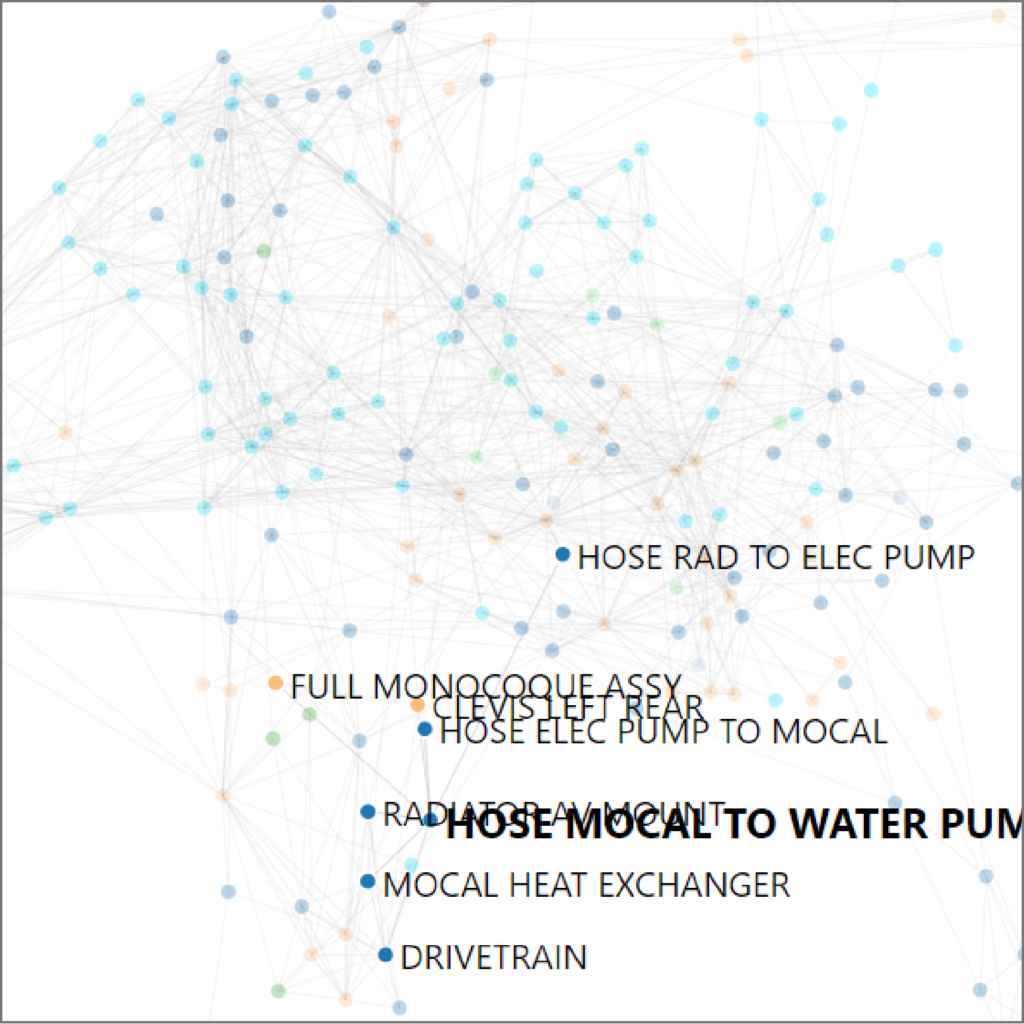
The inter-relationships between systems and teams across projects and organisations can heavily impact project performance.
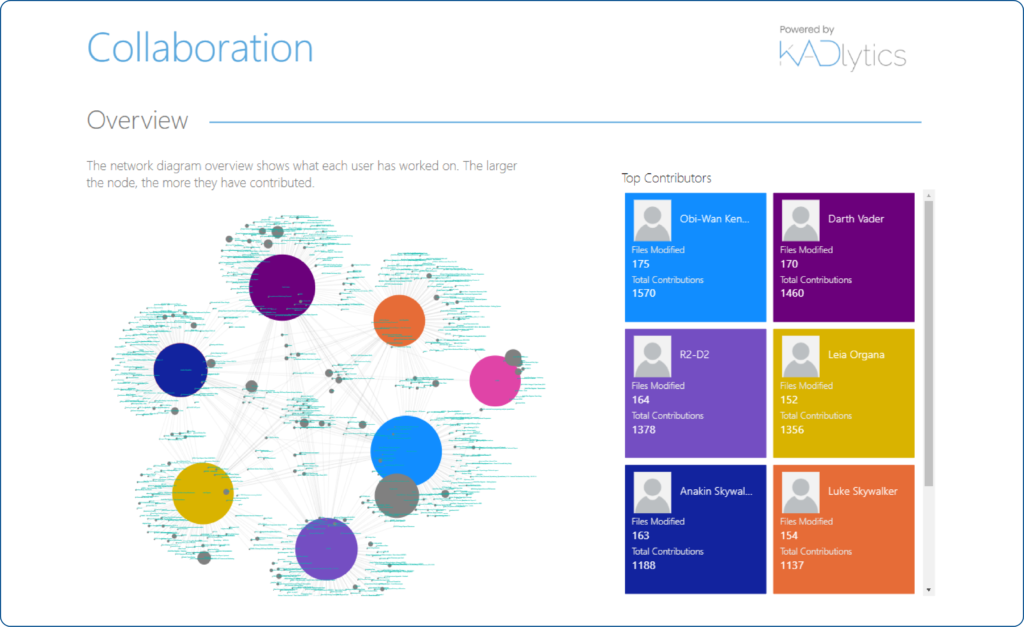
Our tools capture and map collaboration between teams and structural and team dependencies, allowing managers to better plan, monitor, and intervene to ensure that progress is maintained.
Want to know more?
