Workgraphs in action.
These dashboards use real industry data – fully anonymised of course – to show you the power of workgraphs in action.
On Show.
Each of these dashboards seamlessly pulls from existing data stores in real-time to produce actionable information. All names of people and systems have been changed, but the data itself is genuine.
Activity
In today’s world of digital and hybrid working, it’s increasingly difficult to know who’s working on what, where and when.
Our Activity Dashboard provides visibility of individual workers and teams charting what they have worked on during a given period. Learn about the day to day activity of a worker, both over time and with respect to individual assets, systems, and workflows.
This gives managers the evidence and drill-down capability to fully understand and intelligently intervene in the work under their remit.

Activity Dashboard
Scroll through to see examples and access the live demo.
Answer questions such as:
- What have they actually worked on?
- Is it what we expected?
- Are they doing what they should be doing?
- Why are they working on X?
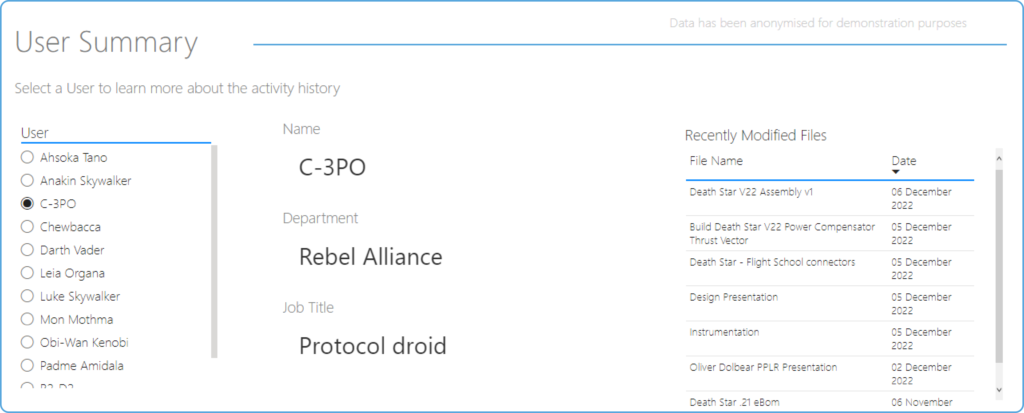
Worker Summary
See the work of anyone, at a glance.
Review and report on the recent work by individuals.
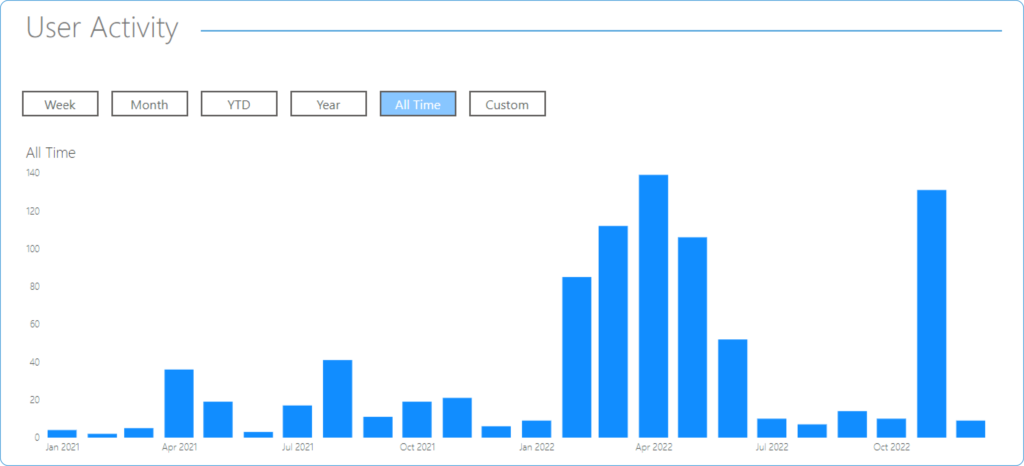
Worker Activity
Review and track activity of a single worker by week, month, or YTD.
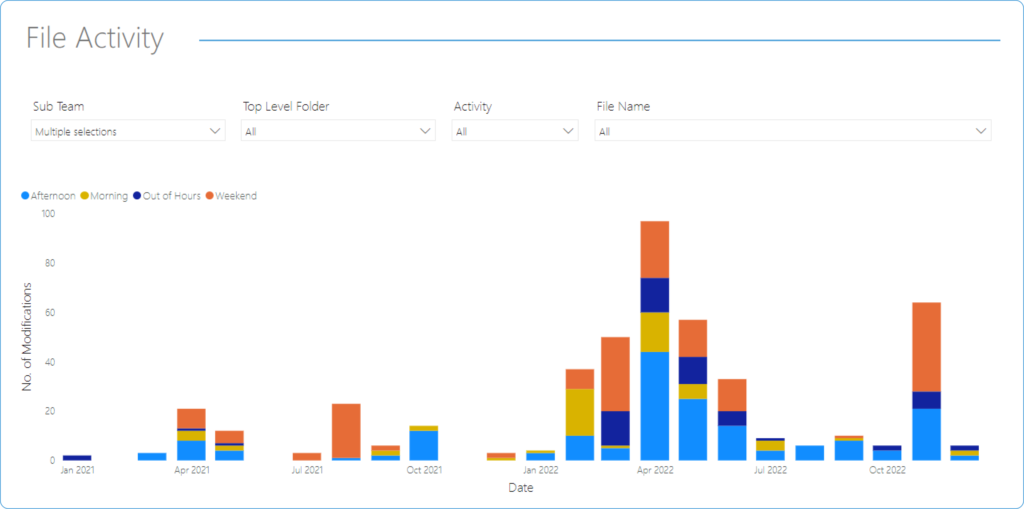
File Activity
See when work took place on individual systems, assets or files, who performed it, and when it happened.
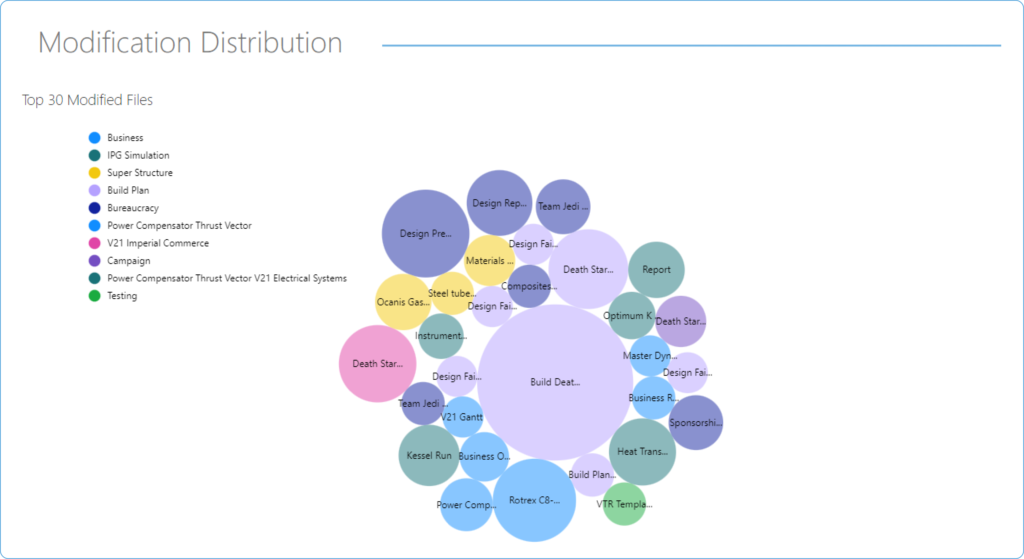
Changes and Modifications
Track where changes are occurring in your projects, who’s enacting them, and where they are causing knock-on effects.
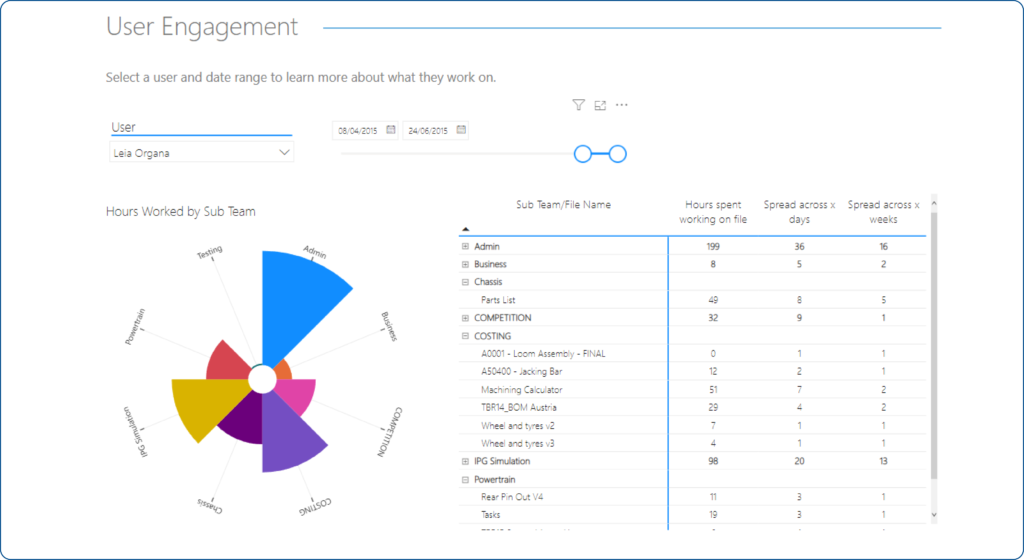
Engagement
Worker engagement is critical for timely and successful completion of any project and is an important factor for productivity and a happy and cohesive workforce. Our engagement dashboard charts the relative engagement of each worker and team to projects and workflows, letting managers see where people are dedicating their time and how much time they are able to give.
Engagement Dashboard
Scroll through to see examples, and access the live demo.
Answer questions such as:
- Are they engaged with the project?
- Are they engaged with the right work?
- How engaged are they compared to others?
- Should they be doing more, or less?
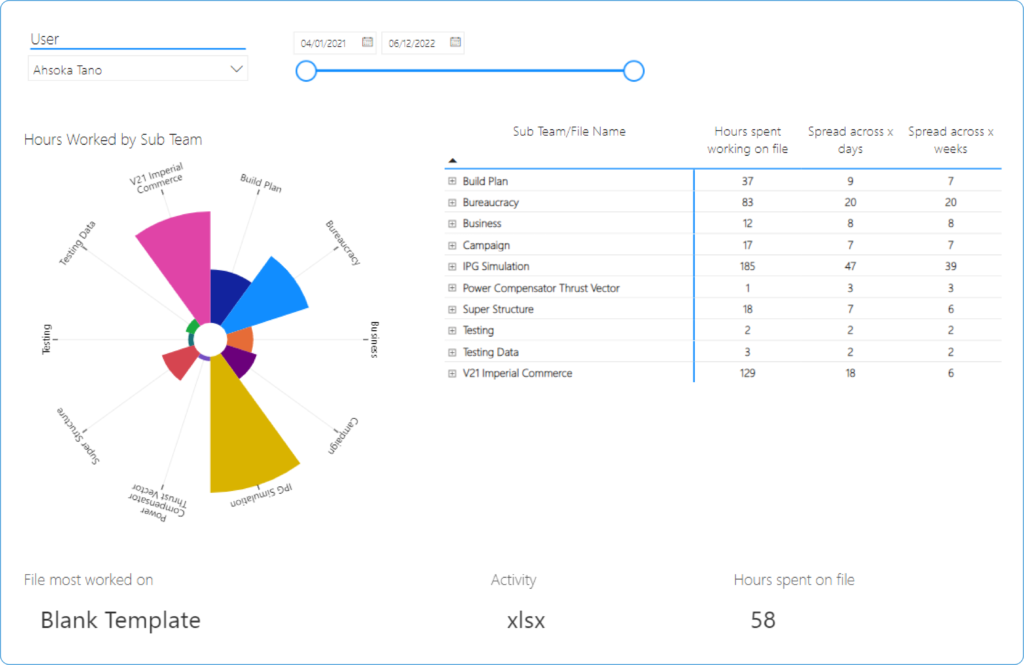
Worker Engagement
Review an individual’s relative engagement in projects and teams.
See where they spend their time, how much they give, and if it aligns with plans and expectations.
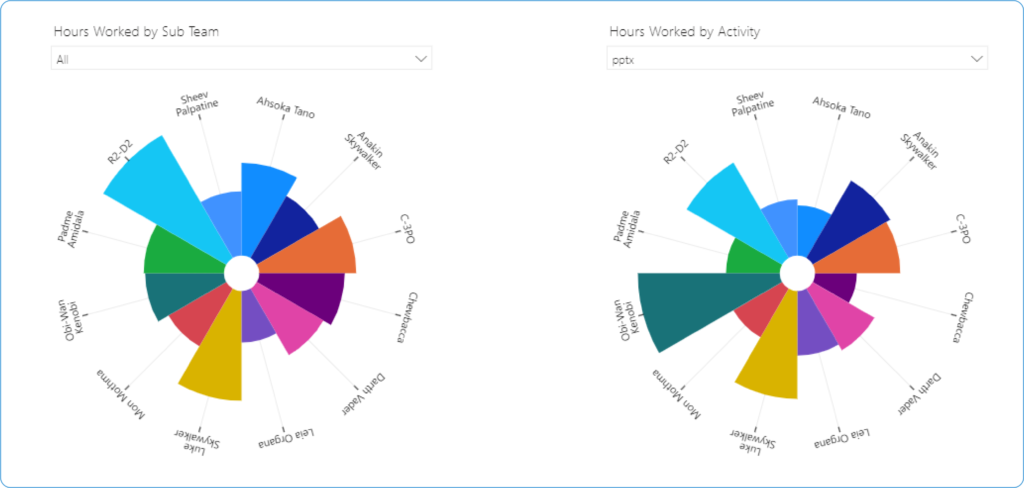
Worker Comparison
Drill-down into the engagement within teams and across teams.
Compare engagement levels, see who is committing the most, and those that play central or superficial roles.
Worker Health
A healthy workforce is a productive workforce.
While flexible working can be hugely beneficial allowing workers to contribute almost anywhere and at any time, managers cannot easily identify periods of low or high intensity of those who are working potentially unhealthy patterns. Our health dashboard provides unique insights into the working patterns of your staff so you can tailor your policies for individual workers or teams and identify peaks and troughs in workload.
Health Dashboard
Scroll through to see examples, and access the live demo.
- How do their work patterns vary?
- Are they working within our policies and normal hours?
- What work is happening outside normal hours?
- Are there any signs of overloading or burnout?

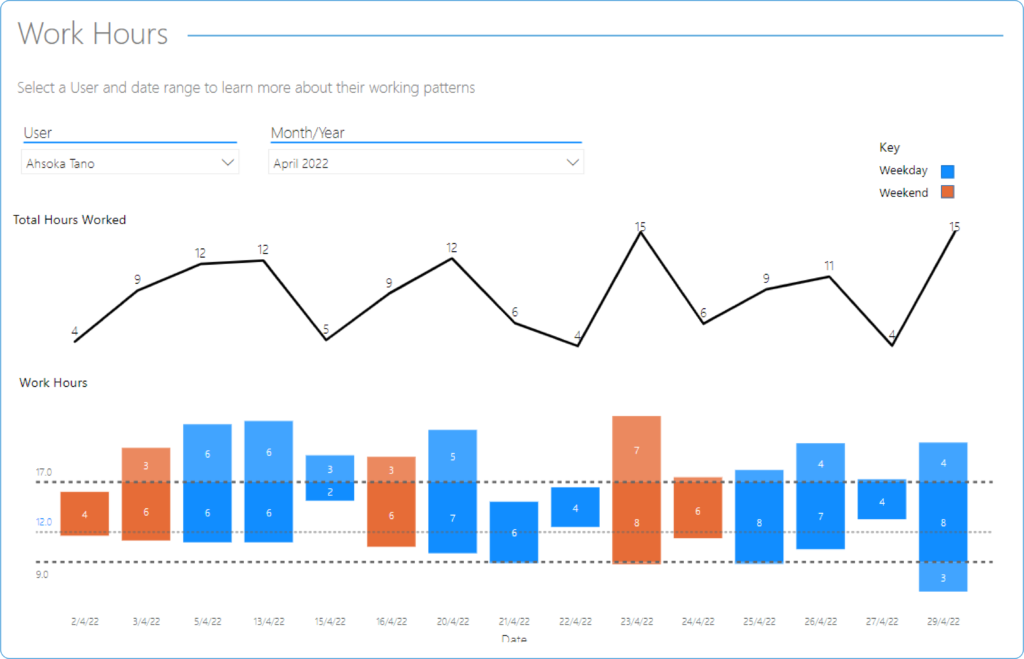
Work Hours
Review an individual’s working pattern over a work, month, or YTD.
Review that they’re working in a consistent and healthy way, whether they’re over-worked, crunching for deadlines, or not available when they could be.
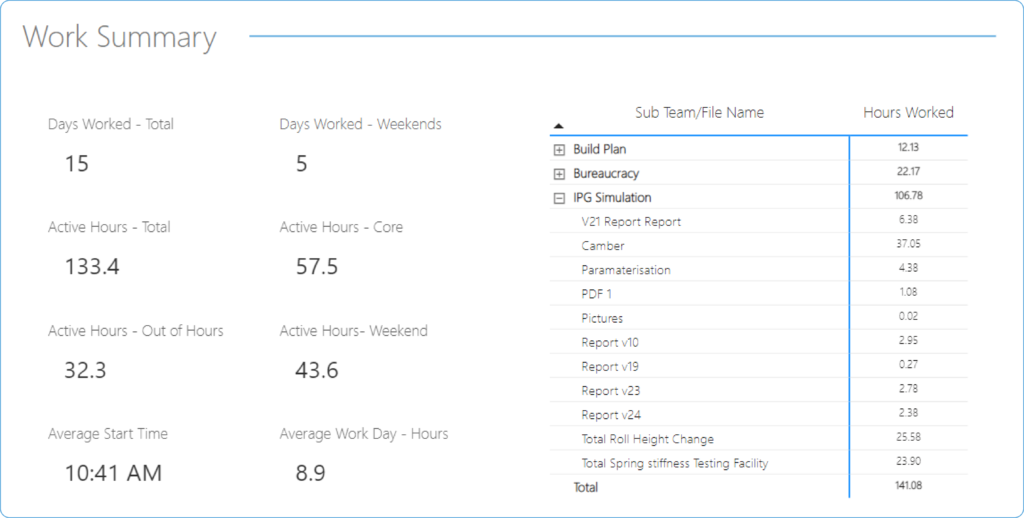
Work Summary
See the working patterns of an individual at a glance.
Report on their working patterns, and see how they’ve split their work between projects and activities.
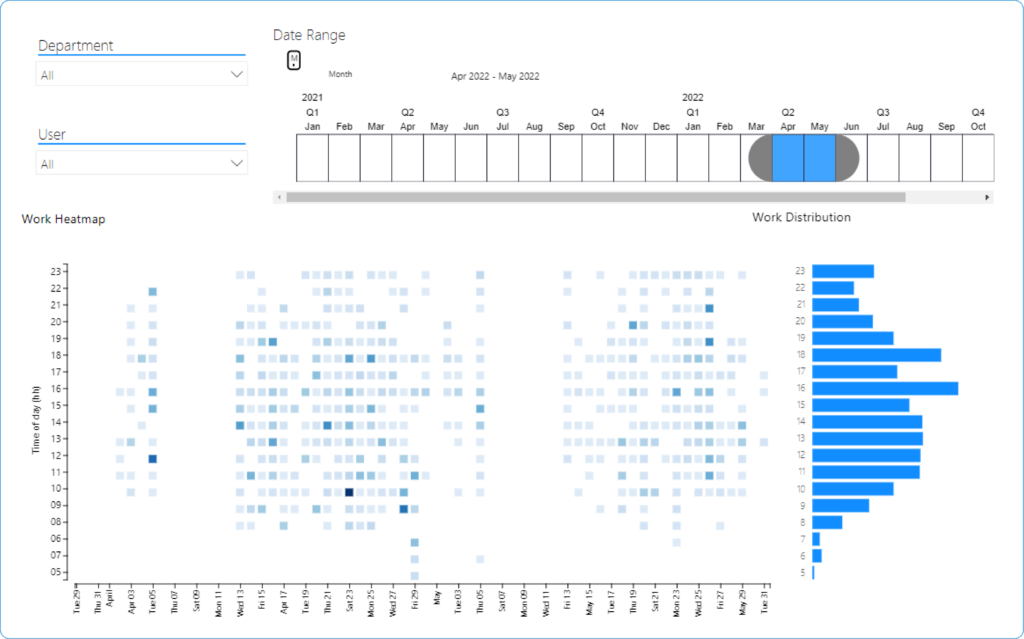
Work Map
Drill down to explore the details of an individuals work over longer periods.
See how they distribute their work through the day and entire project timelines, and use that information to better allocate resources and efforts in the future.
Composition
Ensuring that the right mix of workers as defined by role, expertise, discipline or mindset contribute to work is not simply a case of defining the team composition at the outset.
Our Composition dashboard provides visibility of projects and workflows by role, expertise and other characteristics enabling you to analyse your team composition and diversity, how each team member is contributing to the whole, and to report on and evidence EDI across your teams and your organisation.
Composition Dashboard
Scroll through to see examples, and access the live demo.
Answer questions such as:
- Who had contributed to what work?
- Who has had sight of the work?
- How inclusive has the work been?
- Is our project and team diversity as expected and appropriate?

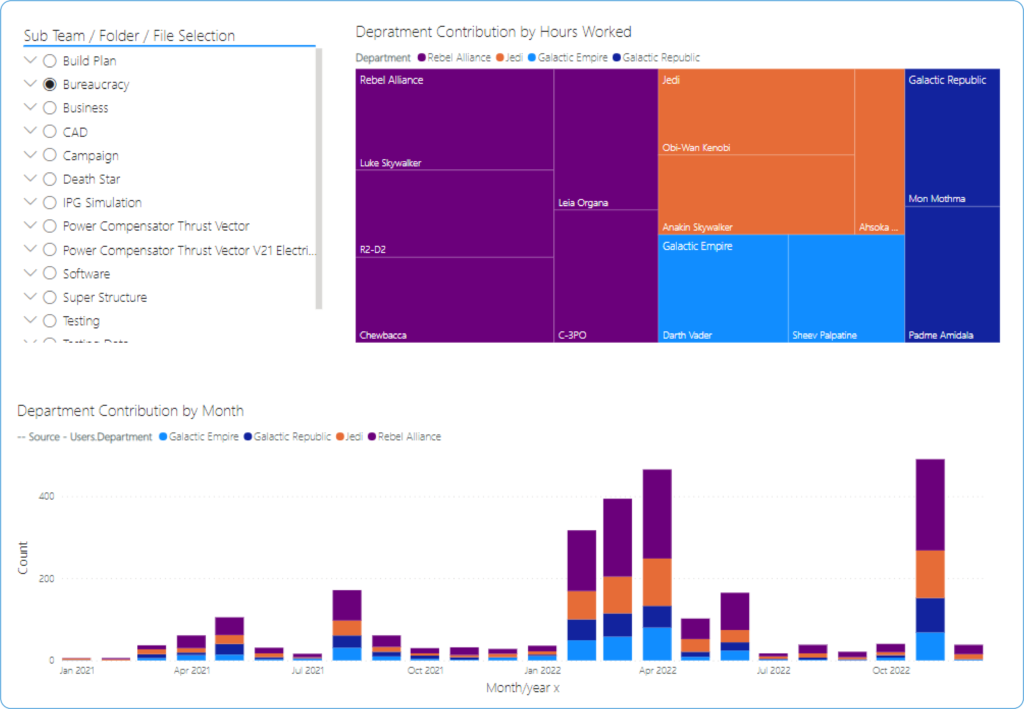
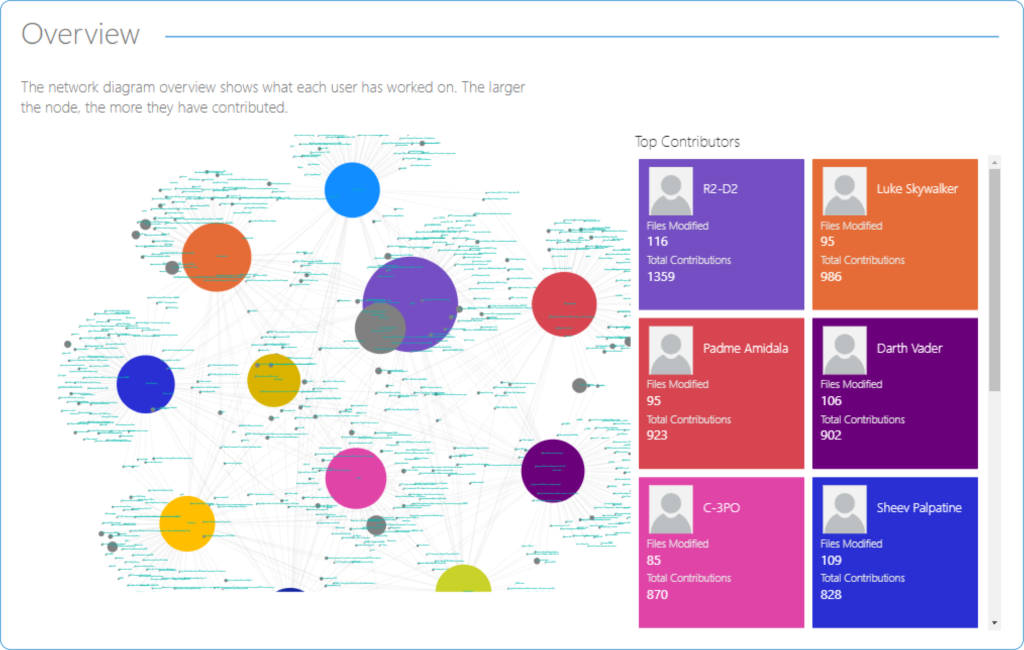
Workforce Contribution
Review and report on the contribution of each worker across the project, team, department, or organisation.
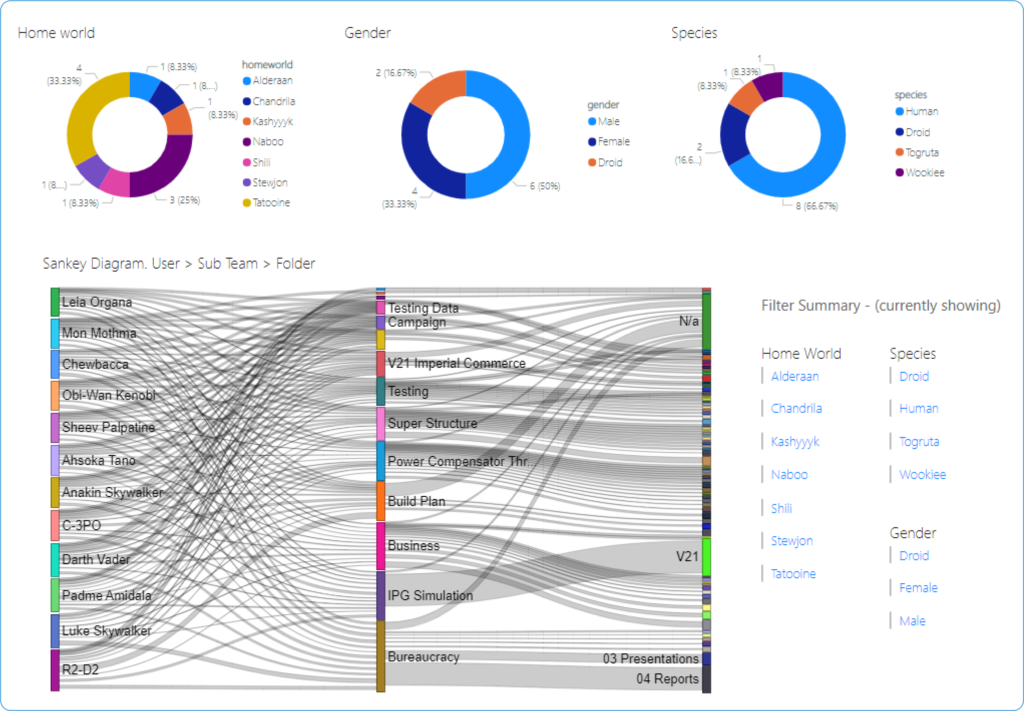
Workforce Diversity
Review and report on the diversity of contribution to work and projects.
Visualise the contributions and efforts of different people and groups to the project or an organisations work.
Collaboration Dashboard
Understanding how your workers and teams collaborate is imperative for productivity and overall management.
Our Collaboration dashboard reveals who is collaborating with who, when and on what. Drill down capability enables hidden dependencies to be identified including cross team/project/department. As well as ensuring the smooth running of current projects such knowledge can be beneficial for defining new or agile teams.
Collaboration Dashboard
Scroll through to see examples, and to access the live demo.
Answer questions such as:
- Which activities are collaborative or siloed?
- Who’s collaborated on this asset, or with this worker?
- Who does this person work with?
- If this changes, where is rework likely to be needed?

Workforce Collaboration
Review and report on the inter-relationships between workers and work across larger projects and organisational structures.
Get an overview of the real collaborative structure of projects.
See who is likely to feel the impact of changes, and who should be in the know about ongoing work.
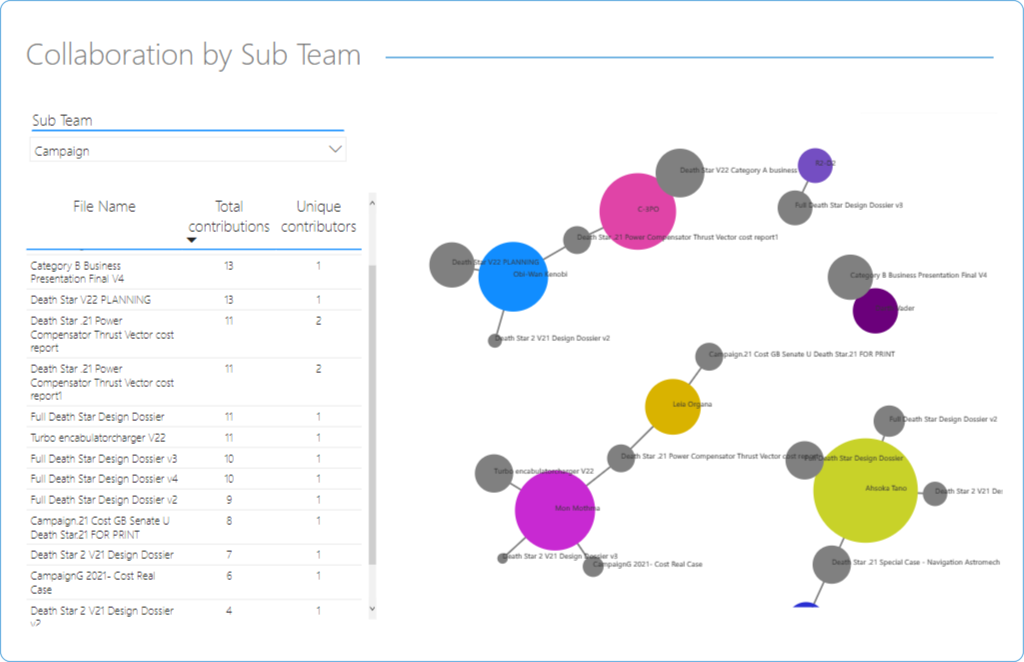
Team and Project Collaboration
Drill down to explore and monitor work relationships within teams and groups.
Identify sub-teams and gatekeepers, and check that they are working as they should.
Navigate the dashboards through the arrow keys at the bottom of the window, or click the number to jump between.