Insights into technical dependencies during New Product Development avoids rework and late changes
When designing new products or undertaking significant upgrades to existing products, it’s rarely possible to establish all dependencies in advance. Many dependencies emerge as the product develops, with evolving relationships between systems and components that create a complex web of dependencies that engineers have to navigate.
Typically, it’s the dependencies that aren’t pre-planned that cause costly rework and delays. By identifying these dependencies as they appear and highlighting them to workers and managers,
Such hidden or emerging dependencies are frequently the cause of costly rework and delays.
In the software industry automatically detecting and mapping dependencies is a multi-Billion dollar business, but until now hasn’t been transferable to any sector outside of network infrastructure and architecting.
Challenge.
We worked with the team behind a leading formula race car to automatically map the technical dependencies within their product – identifying what systems, files, components, and activities were dependent on what others.
This system contained many 100s of sub-systems and components with 10,000s of connections, with an architecture that grew, shrank, split, and merged over time. Simultaneously, many 10s of workers would interact with the system at different levels, creating a high rate of change and complex web of collaborations.
The complexity and scale make it hard to predict dependencies prior to development, while the rate of change makes it hard to capture and management as development continues.
By building a map of technical dependencies, we aimed to allow managers to better understand where rework might occur, to better organise activities to avoid complex inter-dependencies, and to better deploy staff to areas of high risk or difficulty.
While this case focuses on a mechanical system the principles directly transfer to many sectors – anywhere that people work on digital files towards a common goal and deliverable.
Approach.
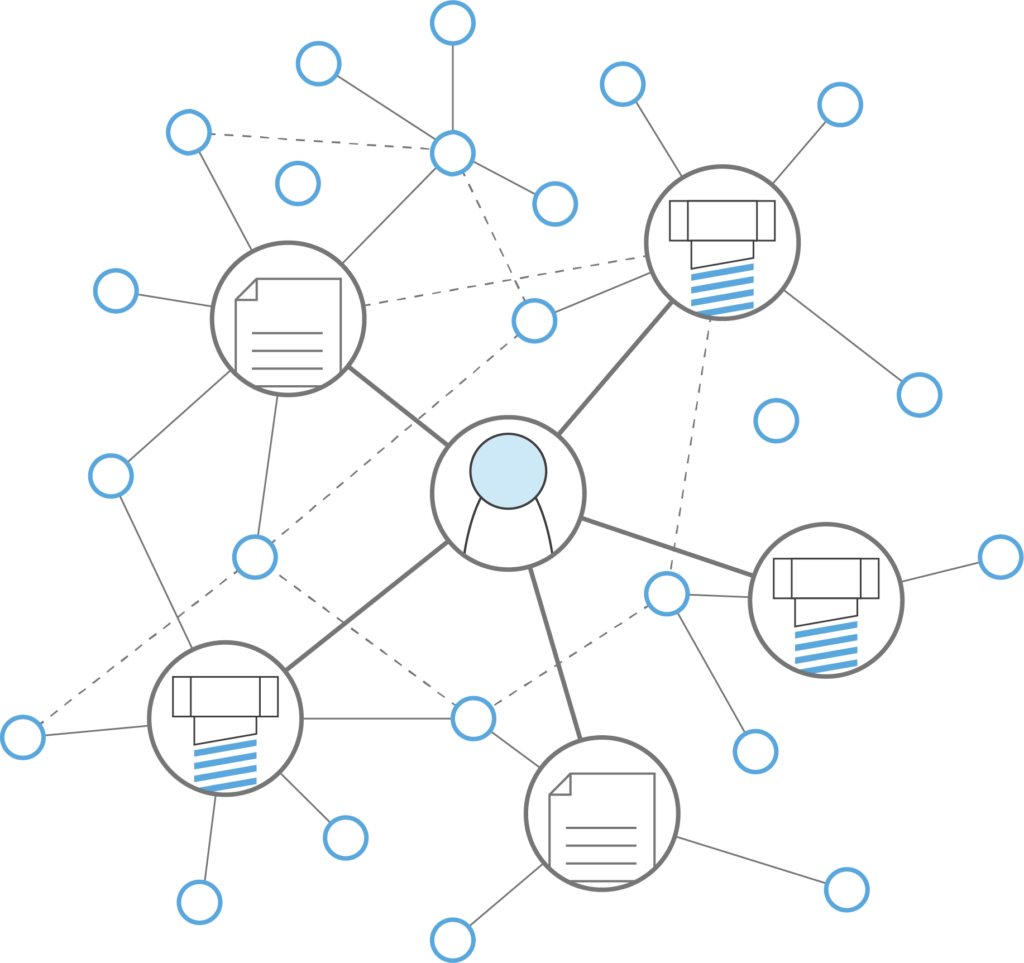
To meet our clients aims, we built maps of the digital engineering work of each person, team, and asset within the project.
This let us capture, map, and analyse evolving work graphs of activity that encompass all aspects of project working, and infer potential dependencies between engineering systems, sub-systems and components.
KADlytic’s tools infer dependencies as they appear in real-time, or can be applied to historical data to understand past projects and structures, which in turn can be used to better plan for the future.
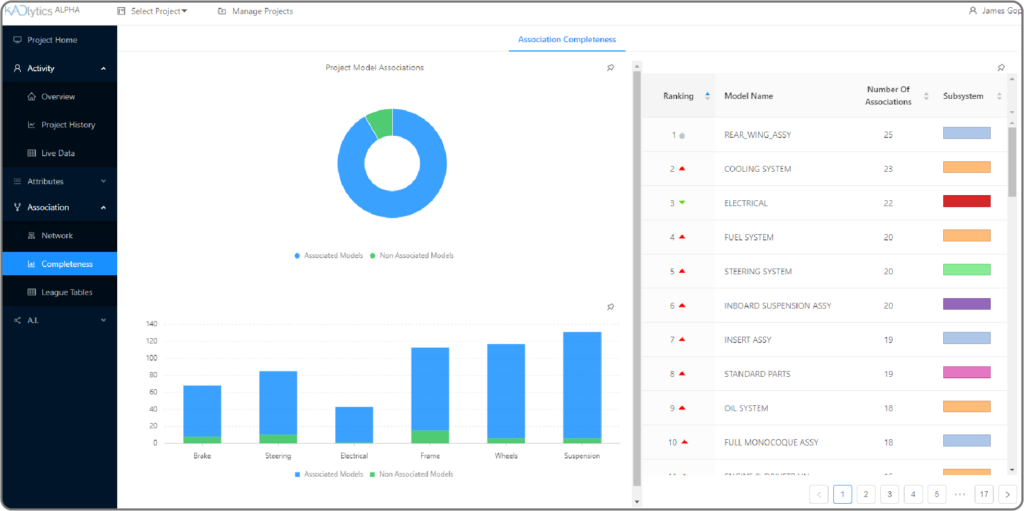
Once built, our dependency map could be visualised and analysed in any number of ways, creating an interrogable object that managers could use to streamline their work.
Benefits.
Our analysis automatically generated a map of dependencies for the system. This went beyond a simple map, including:
- Interconnections between all assets according to real inter-dependencies
- Highlighting of potential rework due to upstream changes of any asset or system
- Activity tracking across all teams and personnel interacting with all assets
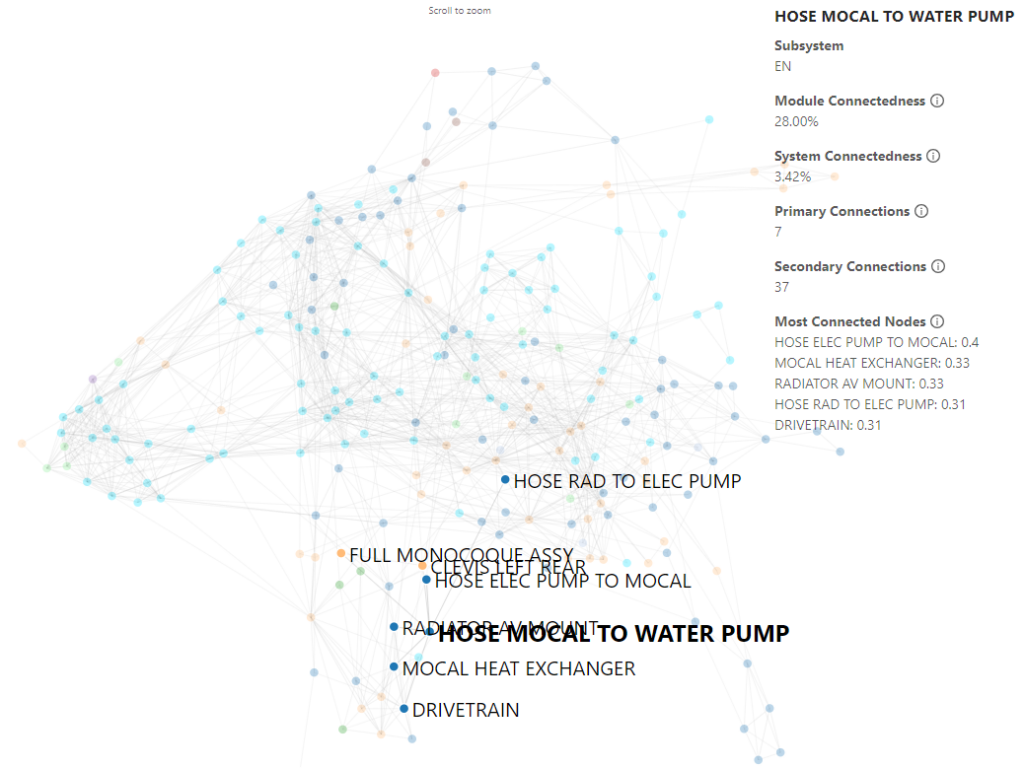
- Modularisation scores, indicating how isolated or connected a system was and hence how risky it was to edit
- Critical system analysis, highlighting those parts of the system upon which other relied and which would need additional control
This workgraph created a detailed data source that supported investigation, analysis, and decision-making across purposes, as well as automated monitoring and flagging of events, record keeping, and product auditing.
Core opportunities include identification and monitoring of critical dependencies to ensure productivity and avoid delay, identifying critical paths for efficient system development and stage-gating, optimisation of system structures to support efficient working, and support scenario planning by exploring the potential impact of changes, events, and interventions.