Insights into Team Dependencies and Team Structures increases productivity by 15%
Team structure heavily impacts productivity.
Where teams are new, projects are large, or where team members work across multiple projects, agile management approaches are needed.
However, team structures and co-working are often only outlined or recorded in initial planning and don’t reflect the reality of complex collaborative working.
Without up-to-date and accurate data on team working, the evidence to support decision-making and increase productivity is all too often non-existent or severely lagging.
Challenge.
We worked with the large multi-disciplinary team behind a leading formula race car to increase visibility of activity, leading to the ability to make better decisions.
We were tasked with providing the means to monitor, review and evaluate team structures and dependences based on what was actually completed, not just what was planned.
This needs to go beyond the work of individuals or within teams to include both formal and informal cross-team coworking and collaboration in different time zones.
Approach.
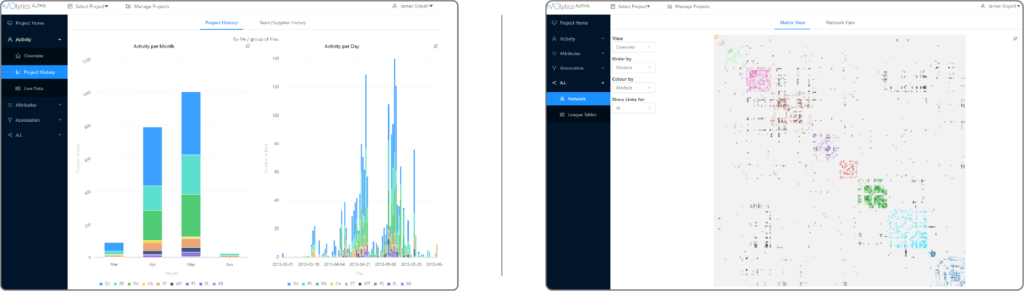
KADlytics’ tools monitor the digital engineering work of the entire team – both as a whole and as individuals.
We deployed our tools to automatically build a workgraph of team interactions across the entire system, identifying teams of people and teams of teams related by their work that transcend pre-planned structures.
Analysis of this workgraph went beyond simple activity monitoring, and empowered us to identify workflows and hidden structures in the ways that teams collaborated. As expected, these ‘real’ inter-team and inter-personal dependencies transcended planned team structures creating working groups across projects and even companies.
Benefits.
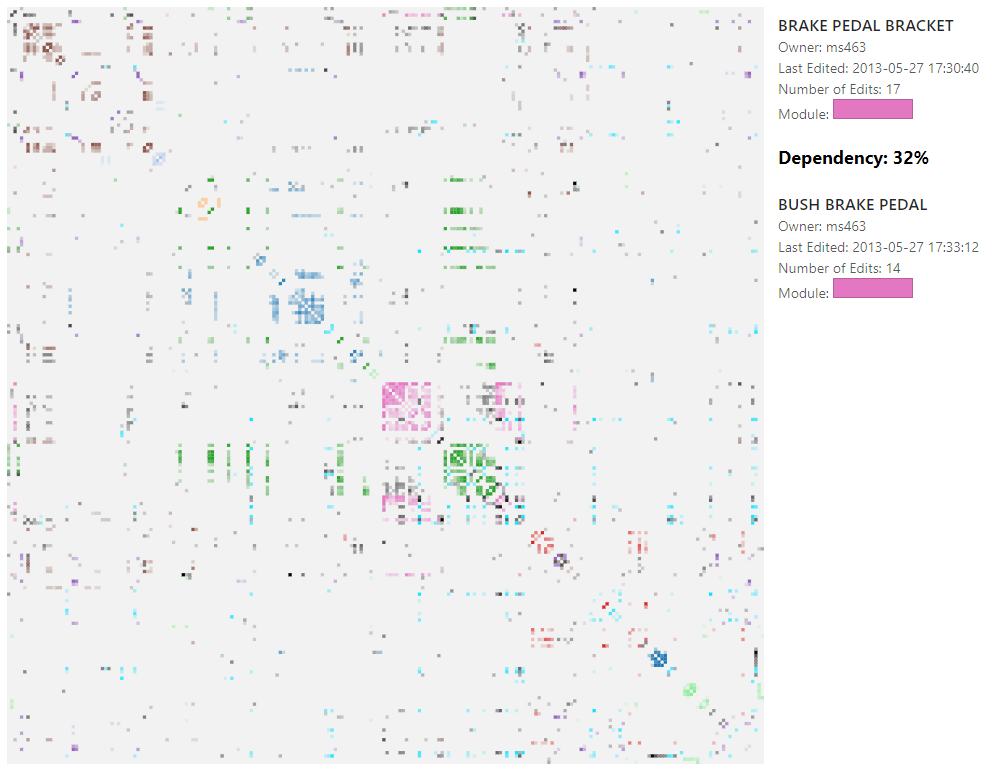
From our team structure visualisations, managers were able to build a real-time and evidenced-based understanding of what was actually happening within their projects, as it happened.
Placing this data at the fingertips of decision-makers empowers them to make the right decisions, investigate the effectiveness of their teams, and learn from past successes to improve in the future.
Amongst many capabilities, managers were able to evaluate the roles of team members, cohesion of teams, team configurations and levels of inter-team dependency, letting them determine if their structures were well-suited to the reality of work. One example of intervention made was to reschedule work to balance workloads and manage deadlines across timezones.
By focusing on individual teams or workers they identified gate keepers, which people should attend what meetings, and who should be moved to increase productivity elsewhere.
Through the combinatory effect of having the detailed evidence that we provided, managers were able to realise a 15% improvement in performance and productivity for a multi-disciplinary team of 40.