Platform-spanning workgraphs power up decision making in complex and large programmes of work.
Major programmes, such as those involving infrastructure and long-life assets, can span many decades and involve thousands of stakeholders.
We worked with UK’s Atomic Energy Authority to help them navigate the complexity of their projects, and deal with challenges of:
- Understanding who did what and when
- Identifying key personnel and gatekeepers
- Succession planning
- Ensuring that only the right people attended the right meetings – not everyone!
As well as spanning many different software environments and servers, data went back more than a decade. A wealth of users, managers, suppliers, and contractors all appeared in the system, each creating, accessing, and editing files and assets through their day to day work.
Our Approach
By mirroring their data across PDM, PLM, and SharePoint, we were able to create a single real-time ground truth on which to run our software.
We applied our workgraph technology to the entire dataset, simultaneously mapping across all subsystems and platforms to analyse user engagement, scope of contribution, work relations and structural clusters of related activity.
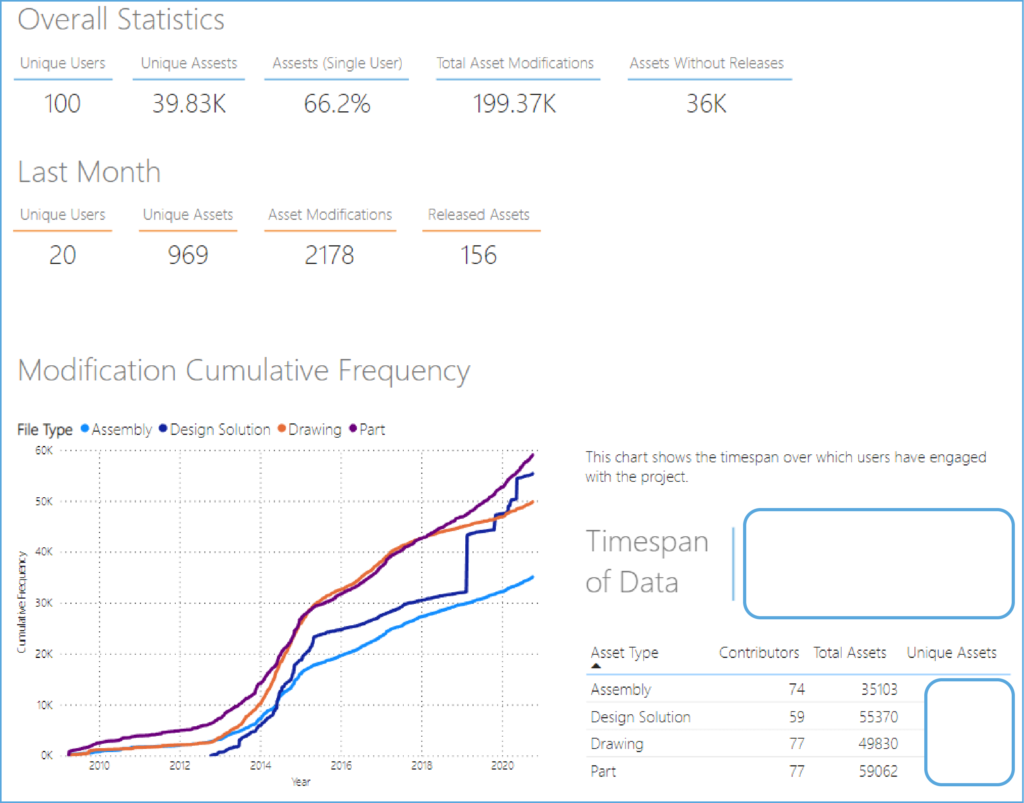
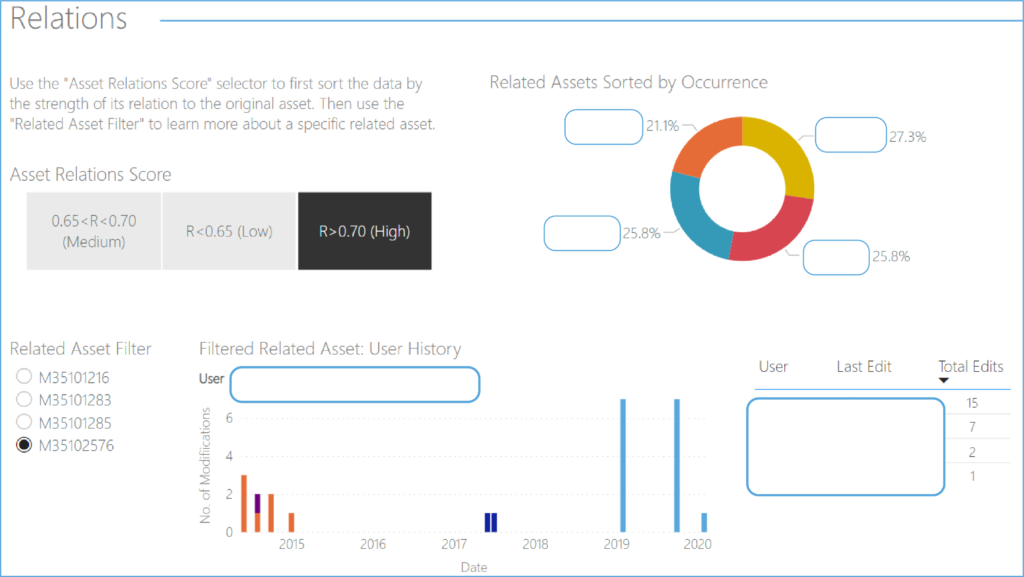
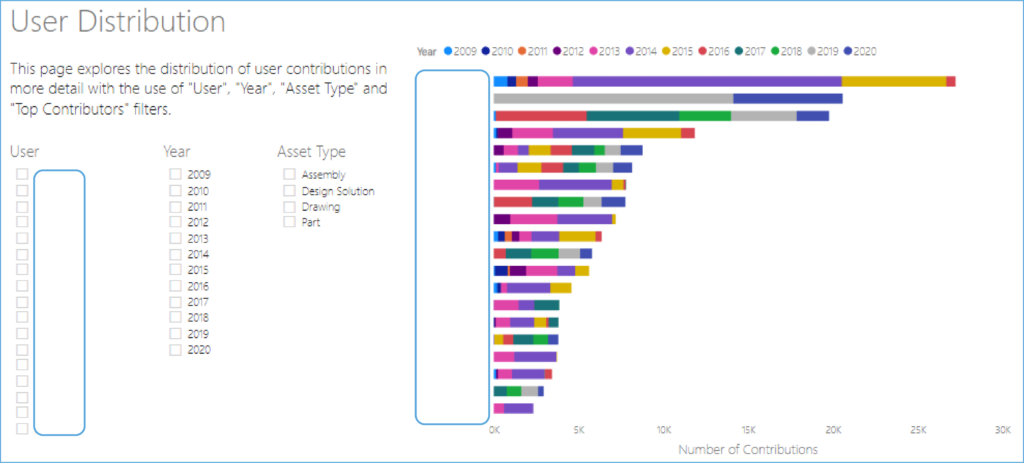
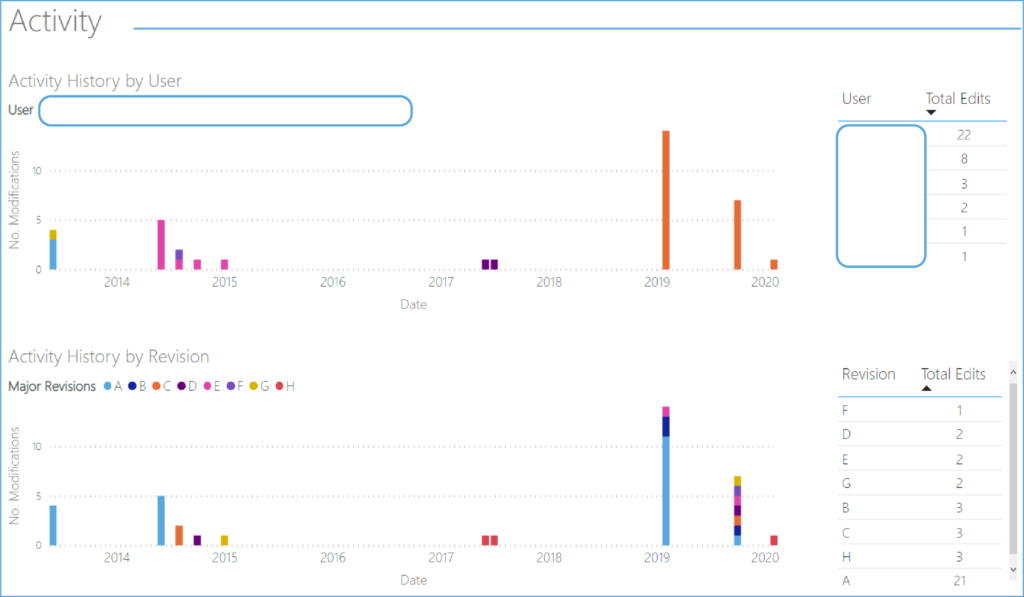
Custom real-time dashboards created in PowerBI provided the reporting and drill-down/roll-up capability for team leads, managers and directors to interrogate the data, and evidence-base their interventions.
Each dashboard was live and interactive – managers could select assets, users, timespans, and more to navigate project data and focus down on the information that was most important to them.
The dashboards below show just four of those we produced (anonymised, or course!).
Benefits
For the first time, stakeholders had visibility of who did what and when. This gave them unprecedented access to their project data, seeing how it evolved, grew, and progressed at any point in it’s history.
Amongst many benefits, managers highlighted:
- Appraisal of user engagement (activity) identified a number of key personnel involved in checking, confirming and updating documents.
- Whole-team and department analysis aided distribution of incoming work as well as analysis of variance for previous projects/jobs.
- Overlaying staffing age ranges revealed areas of exposure/risk to staff retirements and churn aiding staffing and succession planning.
- Drill-down through users of clusters of assets (documents/files) helped inform resourcing, ensuring that the right people attended the right meetings in order to efficiently deal with change/approval requests and upgrades.
This data powered up decision-making, giving managers the ability to make numerous efficiency and productivity improvements in their teams.