Automated BIM management in large construction projects saves 100s hrs for BIM Managers and helps avoid costly delays
Large construction projects involve many organisations each of which are responsible for different aspects of design and engineering.
Programmes can take many years to complete requiring all aspects to progress from conceptual design through to technical design and, in most cases, meeting BIM level 2+.

Periodic and stage-gate reviews of the status of the build via the BIM model are key to project success – cost, quality and time.
Construction companies and design authorities spend considerable time and effort in understanding how the BIM model has changed between reviews and the maturity of elements of the BIM model.
This task is the responsibility of the BIM Manager and Programme Management team.
High time commit is driven by scale – typical projects comprise more than 10 suppliers, 100+ users and involve creation and modification of 500,000+ BIM elements.
The scale of this task creates the classic ‘work about work’ problem – to gather the information that they need to be effective, managers expend huge effort simply navigating and searching for project data.

per-person, per-second created in 2020

per week finding documents and files

of our time spent on work coordination
Challenge
We worked with a major infrastructure provider to map their BIM compliance and project maturity as it progressed.
We were tasked with providing a direct finger on the pulse of their progress, monitoring progression rates across workstreams simultaneously, auditing compliance of work completed, and highlighting areas where concerted effort would be needed to counter delays.
All of this information would feed directly into their monthly reviews and real-time decision-making.
Achieving this task meant building up a detailed map of all assets across the project and automatic auditing of their status against a known standard – no small feat when assets number in the hundreds of thousands.
Approach.
KADlytics’ tools automatically measure and report on the amount and type of work performed on the BIM model since the last review, by monitoring asset creation and modification.
Once measured, our tools also automatically assess the compliance and maturity of each element of the BIM model against RIBA stage gates, allowing managers to measure and monitor progress.
Benefits.
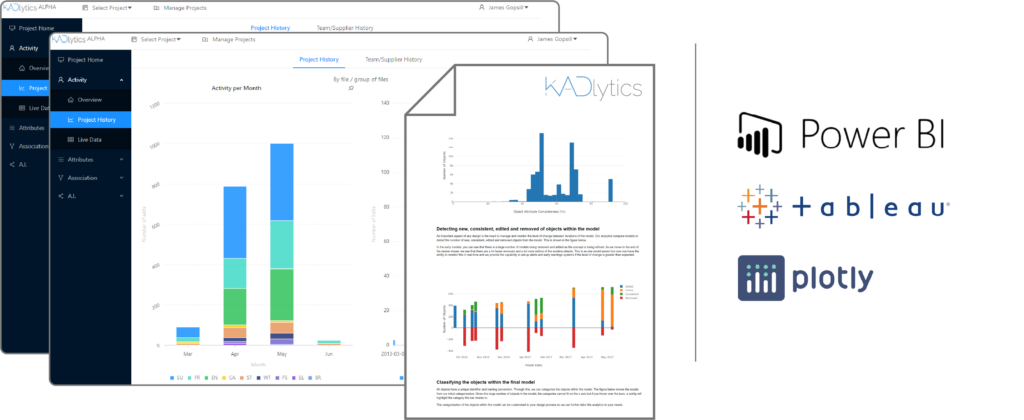
This data is processed and packaged into customisable visual dashboards and reports representing the state of the build.
Removing the need to manually search enables a productivity step-change for BIM managers (saving 100s hours of error prone compliance checks) and an evidence-base for stage-gate and review meetings, as well as performance management of suppliers both within and across projects.
During later stages of the programme, changes to the BIM model can be automatically reported and included in routine reporting, and the state of the build can be used to assess compliance with engineering change processes.
Beyond these, managers also reported benefits in coordination management:
- Coordination across teams and suppliers, managing dependencies and bottlenecks
- Performance management across teams and suppliers, through an evidence base of progression rates
- Workload and resource distribution across both teams and suppliers